Setting Up Longitudinal Tracking with Topify
You cannot identify these trends with a spreadsheet. You need a database. Here is how to configure Topify for historical analysis.
Step 1: Establish Your “Golden Set” of Keywords
Do not try to track history for 10,000 keywords. Select 50-100 “Golden Keywords” that drive revenue.
Action: Lock these in Topify for daily snapshots. This builds a pristine historical dataset free from noise.
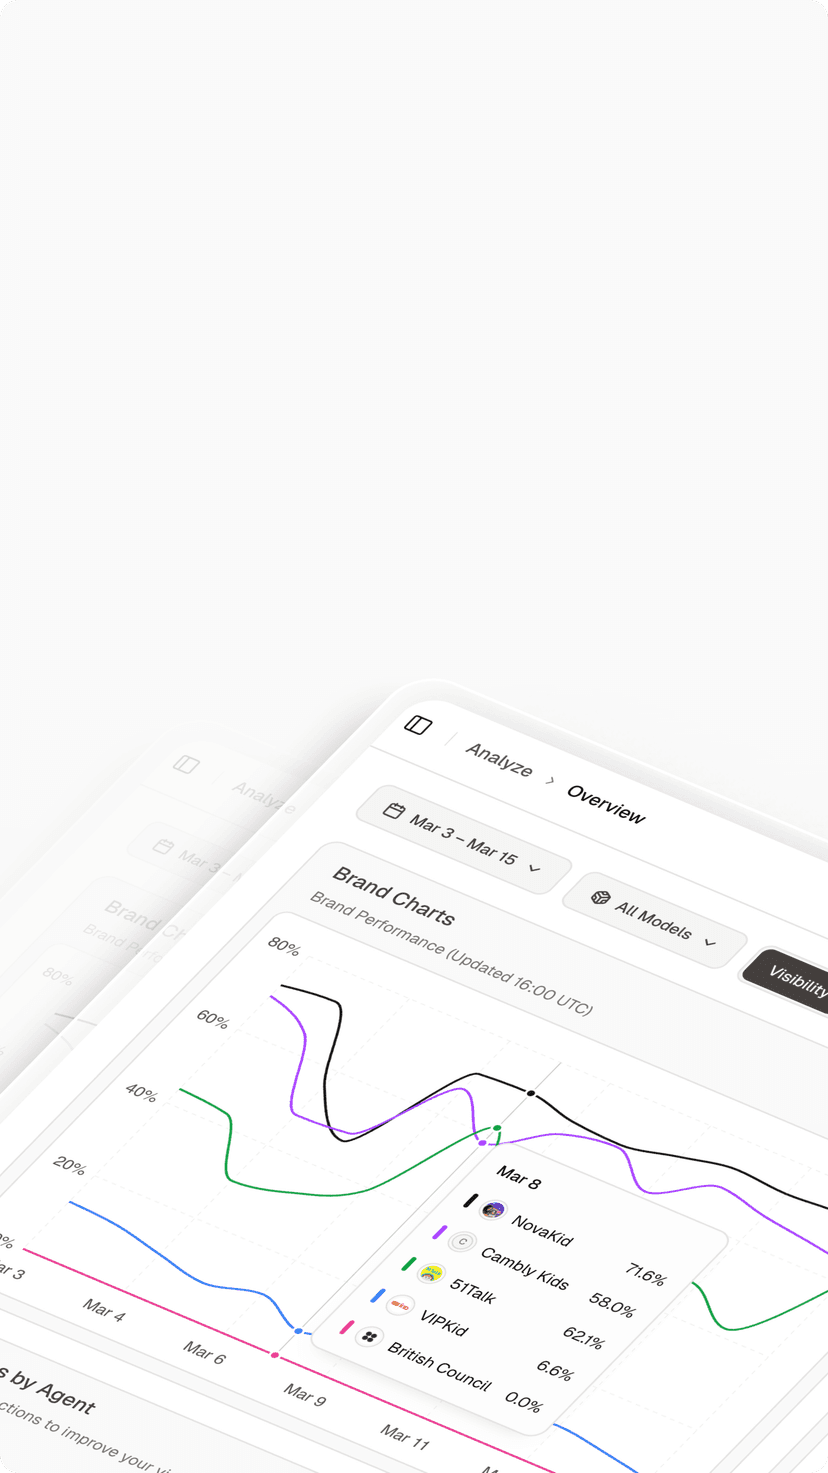
Step 2: Monitor the “Trend Line” vs. “Daily Line”
Topify visualizes two lines on your dashboard.
Daily Line: Shows today’s fluctuation (Noise).
Trend Line: Shows the 7-day moving average (Signal).
Strategy: Ignore the daily line. Only react when the 7-day trend line breaks its support level.
Step 3: Annotation of Algorithm Events
Google updates its Gemini models weekly. Topify automatically annotates these “System Updates” on your timeline.
Analysis: If your visibility drops exactly on the day of a “Gemini 2.0 Update,” you know the issue is algorithmic (e.g., they increased the threshold for E-E-A-T), not technical.
Identifying Trends: The 4 Patterns of AI Visibility
When you learn how to track AI Overviews rankings over time, you will start to see four distinct shapes in your data.
Pattern 1: The “Step Up” (The Goal)
Shape: Flat line → Sharp vertical rise → New flat plateau.
Cause: This usually happens after a successful content engineering strategy implementation, such as adding Schema Markup. The AI “unlocks” your site and re-indexes it as a trusted entity.
Pattern 2: The “Slow Bleed” (The Danger)
Shape: Consistent, gradual decline of 1-2% per week.
Cause: Content Decay. Your data is getting old, and competitors are publishing fresher insights.
Action: Immediate content refresh required.
Pattern 3: The “Heartbeat” (The Volatility)
Shape: Wild swings up and down every few days.
Cause: Semantic Confusion. The AI is unsure if your content satisfies the intent. It usually means your H2s are vague or your structure is messy.
Action: Tighten your definitions and structure.
Pattern 4: The “Cliff” (The Penalty)
Shape: High stability → Sudden drop to zero.
Cause: Safety Violation or Hallucination Correction. The AI has flagged your brand as “unsafe” or “unreliable.”
Action: Conduct a Sentiment Audit using Topify immediately.
Advanced Strategy: Predictive Analytics
The ultimate goal of historical tracking is not just to see the past, but to predict the future.
Topify uses your historical data to forecast your “Citation Probability” for the next quarter.
Scenario: “Based on your current decay rate, your article on ‘Best CRM’ will fall out of the AI Overview in 14 days.”
Benefit: This allows you to be proactive. You can schedule a content update before you lose the ranking.
Correlating Trends with Multi-Platform Data
Trends on Google often foreshadow trends on other platforms.
Leading Indicators: We often see that a citation drop in Perplexity (which updates faster) is a leading indicator of a future drop in Google AI Overviews.
Cross-Platform Strategy: Use Topify to overlay your Google trends with your ChatGPT and Perplexity trends. If you are dropping everywhere, it’s a brand authority issue. If you are only dropping on Google, it’s a technical SEO issue.
Learn more about monitoring these other platforms in our guide on monitoring multiple models simultaneously.
The Economics of Trend Tracking: Proving LTV
Your stakeholders think quarterly. You need to show them that GEO is a long-term asset.
By showing a “Year-over-Year” increase in Citation Stability, you prove that you are building a defensible digital asset. A brand that is cited by AI consistently for 12 months becomes part of the model’s “Long-Term Memory” (training data), which is far more valuable than a temporary SEO spike.
To build this business case, refer to our definitive blueprint for GEO.
Conclusion: Playing the Long Game
In the volatile world of AI search, patience is a competitive advantage. Brands that react to every daily fluctuation will churn out low-quality upda
tes and confuse the model.
Brands that master how to tr
ack AI Overviews rankings over time will see the signal in the noise. They will build authority brick by brick, securing a position in the AI’s knowledge graph that is resilient to daily algorithm shifts.
Use Topify to be the brand that plays the long game. Because in 2026, stability is the new #1 ranking.
FAQ: How to Track AI Overviews Rankings Over Time
How far back does Topify’s historical data go?
Topify maintains an archive of your AI Overview snapshots for up to 24 months. This allows you to perform Year-over-Year analysis to see how seasonality affects AI triggers.
Why did my AI rankings drop on the weekend?
This is a common trend. B2B queries often have lower “Snapshot Trigger Rates” on weekends because Google’s algorithm detects lower user intent for complex business tasks. Do not panic; check if it rebounds on Monday.
What is a good “Stability Score”?
For core brand terms, you want a score above 90 (cited 90% of the time). For competitive non-branded terms, a score above 60 is considered market-leading stability.
Can I export trend data for my BI tool?
Yes. Topify allows you to export CSVs of your daily visibility metrics. You can import this into Looker or Tableau to correlate AI visibility trends with your sales revenue trends.
Does updating content reset my stability score?
It can cause a temporary “Heartbeat” fluctuation while the AI re-processes the new content, but typically leads to a “Step Up” pattern within 7-14 days if the update adds Information Gain.
Is it better to track daily or weekly?
Daily tracking is mandatory for AI. Weekly tracking misses the “Heartbeat” patterns that help you diagnose structural issues. Topify automates this daily check so you don’t have to do it manually.