
Your organic traffic is down. Your keyword rankings haven't moved.
That gap isn't a reporting error. It's Google AI Overviews intercepting users before they ever reach your blue links. And if you're trying to figure out how to track AI Overviews rankings over time with the same tools you use for traditional SEO, you're looking in the wrong place.
This guide walks through what AI rankings actually mean, what you need to measure, and how to set up a tracking system that holds up over time, across platforms.
Your SEO Tools Can't See What's Hurting You
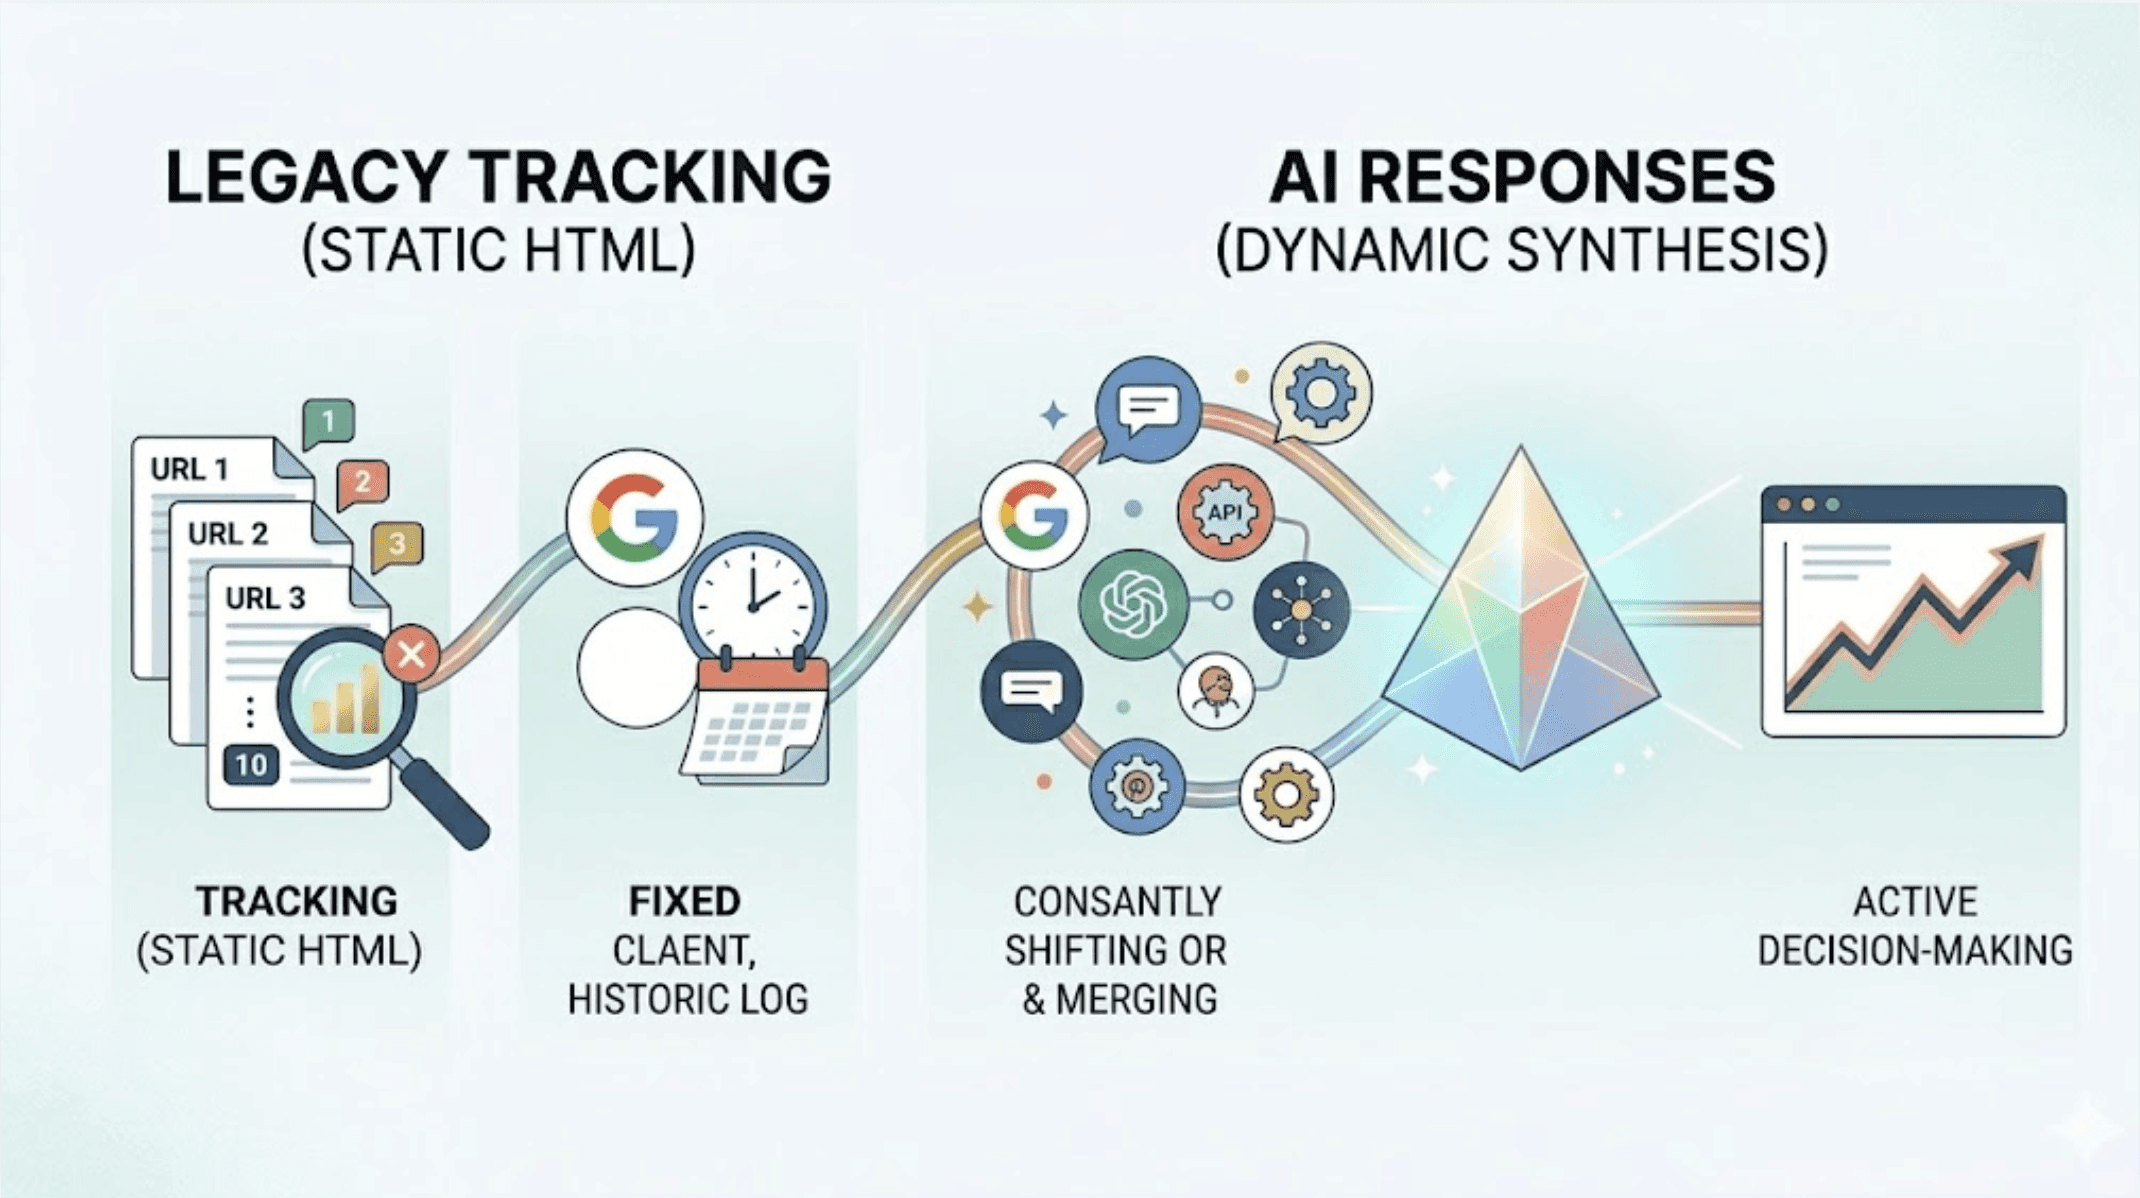
Ahrefs, Semrush, Moz: they were built for a deterministic world. You publish a page, it earns a position, you track that position. Clean, stable, auditable.
AI search doesn't work that way. When a Google AI Overview appears at the top of a results page, the first organic result gets pushed over 1,200 pixels down the page on a standard desktop viewport. That's below the fold before a user ever scrolls. Yet your rank tracker still reports "Position 1."
Traditional crawlers are built to parse static HTML. AI responses are generated in real time, synthesized from dozens of background queries the tool never sees. There's no stable URL to crawl, no position 1 through 10 to log. Your legacy infrastructure isn't broken. It's just tracking something that no longer drives the decision.
What "AI Rankings" Actually Means (It's Not What You Think)
Forget the linear 1-10 model. In AI search, a brand either appears in the generated response, or it doesn't. That binary is the starting point, but professional measurement goes three levels deeper.
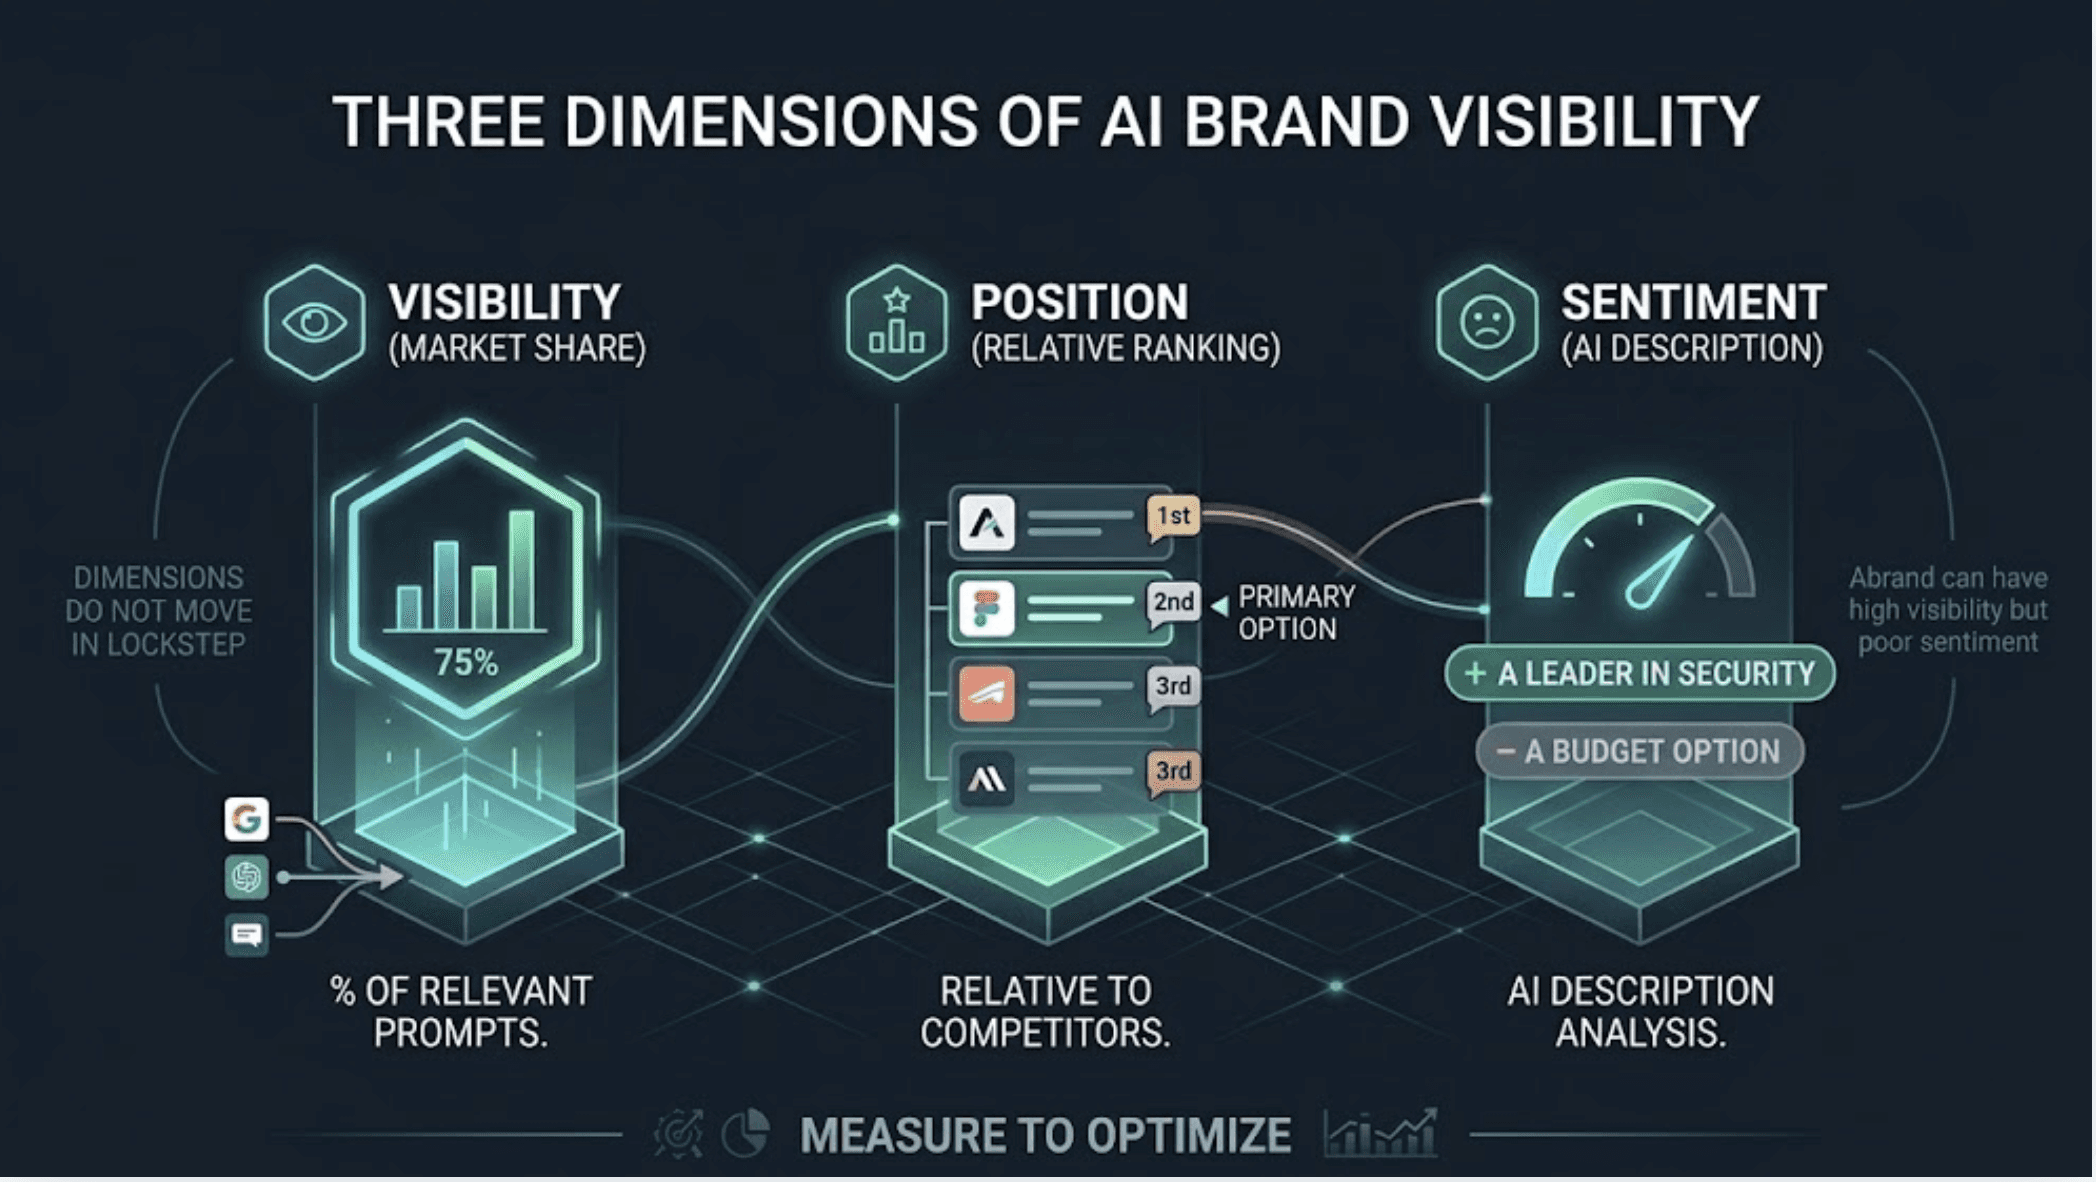
Visibility is the percentage of relevant prompts where your brand gets mentioned. It's your market share inside the model's answer space.
Position is where you appear relative to competitors within the response. Being the first brand named carries different weight than appearing third in a list. Being recommended as the primary option versus mentioned as an alternative is a meaningful distinction.
Sentiment is how the AI describes you. "A leader in enterprise security" and "a budget option with limited integrations" might both count as a mention. Only one of them moves a buyer forward.
These three dimensions don't move in lockstep. A brand can have high visibility but poor sentiment. Strong position on ChatGPT and near-zero presence on Google AI Overviews. You can't optimize what you aren't measuring.
Why Google AI Overviews and ChatGPT Rankings Are Not the Same
This is where most teams get the tracking architecture wrong. They assume a brand visible on one platform is visible on the other. The data doesn't support that.
Only 21.26% of cited domains overlap between Google AI Overviews and ChatGPT. These are functionally different ranking environments with different citation logic.
Google AI Overviews favor editorial authority, established domains, and content that mirrors traditional high-ranking signals. Google cites retailers roughly 4% of the time, because its AI layer sits above a transactional Shopping unit.
ChatGPT fills that gap directly. It cites retailers and product pages approximately 36% of the time, a 9x difference. It also has a strong recency bias: 76.4% of ChatGPT's cited pages were updated within the last 30 days. If your content is stale, you're invisible there regardless of domain authority.
Tracking one platform tells you almost nothing about your performance on the other.
The 4 Things You Actually Need to Track AI Rankings Over Time
Before you pick a tool or set up a dashboard, you need to have these four components in place. Skip one and the data you collect won't be actionable.
A prompt library. AI search doesn't run on keywords; it runs on questions. You need a curated set of prompts that map to how buyers actually talk to AI tools: category questions, problem-specific questions, comparison queries, feature and pricing questions. A well-built library typically averages eight words per prompt, double the length of a traditional keyword. Aim for 20-50 prompts that represent your real conversion paths.
Platform coverage. Your buyers are spread across ChatGPT, Google AI Overviews, Perplexity, and Gemini. ChatGPT alone serves over 300 million weekly users and accounts for roughly 80% of AI-driven referral traffic. You need visibility data from each platform, not an aggregate blend that masks platform-specific gaps.
Historical snapshots. A single data point tells you where you stand today. Time-series data tells you if you're gaining or losing ground after an optimization. Without trend tracking, you can't attribute a visibility shift to a content change, a competitor move, or a model update.
A competitor baseline. AI rankings are relative. A visibility score of 40% is strong in a category where the leader sits at 45%, and weak in one where they're at 80%. You need 3-5 competitor benchmarks to understand whether your numbers are a win or a warning.
How to Set Up AI Overviews Rank Tracking: Step by Step
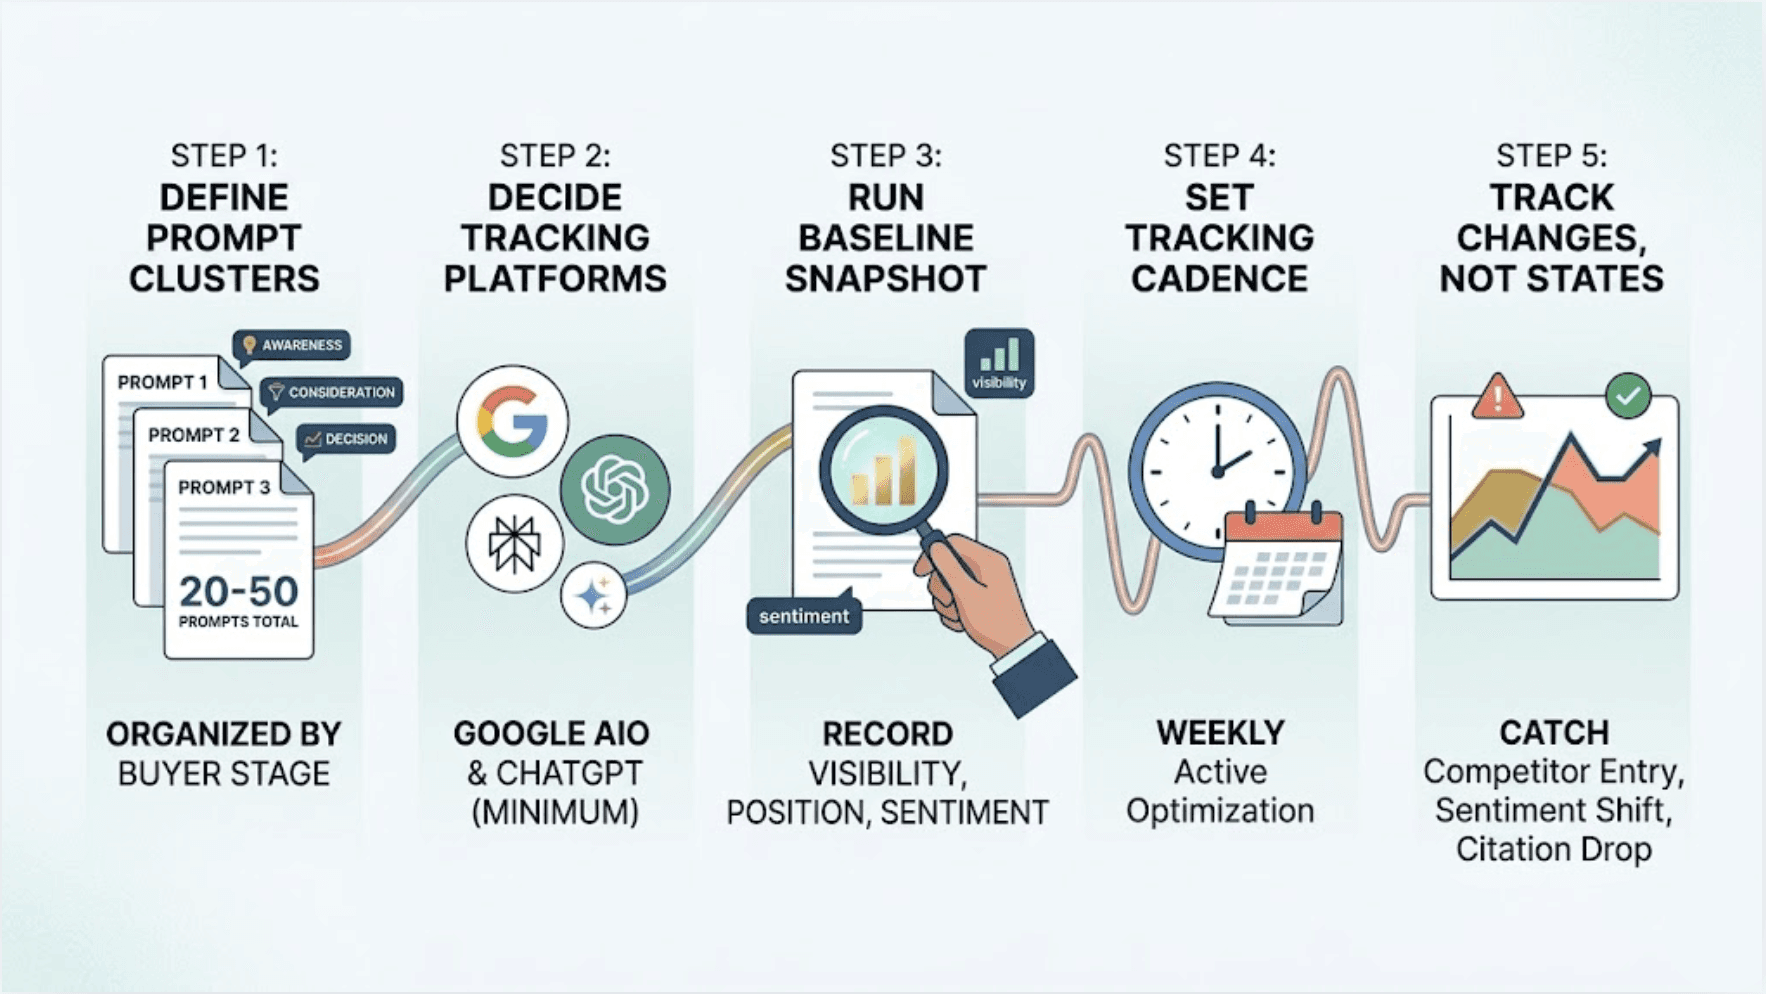
Step 1: Define your prompt clusters. Start with 20-50 prompts organized into three categories: awareness-stage questions about your product category, consideration-stage questions comparing you to alternatives, and decision-stage questions about your specific features or pricing. These should mirror the actual questions your buyers type into ChatGPT or ask in Google.
Step 2: Decide which platforms to track. At minimum: Google AI Overviews and ChatGPT. Add Perplexity if you're in a research-heavy or B2B category. Add Gemini if your audience skews Google-native. Don't try to track everything manually from day one, but don't leave ChatGPT out.
Step 3: Run a baseline snapshot. Before any optimization work begins, record your current Visibility, Position, and Sentiment across all platforms for every prompt. This baseline is your ground truth. It will also surface what some teams call "dark queries": high-value prompts where you're completely absent despite having strong content.
Step 4: Set a tracking cadence. Weekly is the industry standard for active optimization. AI models update frequently. A prompt that generated strong visibility in January may produce different results in March due to model changes or competitor content moves. Weekly data lets you catch those shifts early.
Step 5: Track changes, not just states. The goal isn't a dashboard full of numbers. It's a system that tells you when something meaningful changes: a competitor entering a prompt set where they weren't before, a sentiment shift following a product controversy, a citation drop after a site migration.
How to Track Your ChatGPT Rankings Over Time Specifically
Tracking how to track my rankings on ChatGPT over time requires a slightly different lens than Google AI Overviews. ChatGPT is conversational. It integrates citations directly into the response flow rather than listing them separately, which makes manual extraction harder and automated tracking more valuable.
The primary metric to watch on ChatGPT is the mention-to-citation split. Your brand can be mentioned by name as "a reputable alternative" with no link attached. That mention reaches the user; the click doesn't follow. A citation with a direct URL is categorically more valuable, but 67% of ChatGPT's top citations come from sources brands can't easily influence, like Wikipedia or major press outlets. That makes the influenceable citation sources worth identifying precisely.
On ChatGPT, recency matters more than domain age. If you want to know how to track ChatGPT AI rankings over time and actually move them, the tracking data needs to connect to content freshness. A brand that updates its core pages and earns editorial mentions on recent sources will often outperform a higher-authority domain with stale content.
Also worth noting: AI-referred traffic from ChatGPT converts differently. While AI search overall shows roughly a 75% lower click-through rate than traditional search, the visitors who do click show significantly higher intent. In B2B SaaS specifically, AI-referred visitors convert 4.4x better than traditional organic visitors. Tracking ChatGPT rankings isn't just a vanity play. It's tracking a lead quality signal.
Why Manual Tracking Breaks Down After Week Two
A lot of teams start with a spreadsheet. It works for about two weeks, then stops scaling.
The math is straightforward. A modest setup tracking 50 prompts across 4 platforms on a weekly basis generates 800 data points per month. Add 3 competitors to benchmark against and that jumps to 3,200 data points. Manually querying each platform, logging brand mentions, extracting citation URLs, and tagging sentiment across thousands of responses isn't a workflow. It's a full-time job that still produces inconsistent data.
Manual tracking also can't handle prompt drift. The relevance of a query changes as your product evolves, as competitors update their messaging, and as AI models shift their training emphasis. An automated system catches when a formerly high-performing prompt is losing visibility. A spreadsheet doesn't.
There's also a correlation problem. When a brand earns a ChatGPT citation, it often triggers a spike in branded search volume on Google as users look for pricing or reviews. Manual tracking can't connect those two signals into a unified ROI picture. The impact of AI visibility on downstream branded search stays invisible.
How Topify Handles AI Rankings Tracking Automatically
This is where the setup described above becomes sustainable at scale.
Topify is a GEO (Generative Engine Optimization) platform built specifically for the tracking infrastructure described in this guide. It handles the prompt library, multi-platform monitoring, historical trend analysis, and competitor benchmarking in a single automated system.
The prompt library problem is solved at setup. Topify analyzes your brand URL, identifies your industry and product context, and auto-generates a categorized prompt library. You review, approve, or edit. No manual prompt engineering.
On the tracking side, Topify runs continuous monitoring across ChatGPT, Perplexity, Google AI Overviews, and Gemini. The dashboard surfaces Visibility Trends, Sentiment shifts, and Position changes over time in a format designed for reporting, not just internal analysis.
The competitive layer is where it separates from generic monitoring setups. Topify's Competitor Auto-Detection identifies which brands the AI is recommending in your category, without requiring you to pre-specify a competitor list. It then generates a Share of Voice breakdown, showing exactly which prompts your competitors are winning and which citation sources are driving their visibility. That's the roadmap for your next content move.
For agencies managing multiple brands, the same infrastructure applies across clients from a single dashboard, which is operationally difficult to replicate manually.
If you're ready to move from manual checks to automated longitudinal tracking, you can get started here.
The Numbers That Make the Case
The impact of systematic AI tracking isn't theoretical. A B2B SaaS company using automated AI monitoring discovered it was being excluded from Perplexity answers by a niche competitor despite ranking first on Google. The platform identified the third-party comparison guides the AI was citing instead. Within two weeks of securing mentions in those guides, the brand reclaimed 70% of its lost AI recommendations.
An enterprise CRM platform that tracked and optimized its AI citations over 12 months achieved a 287% increase in AI citations, a 156% increase in qualified leads, and $420,000 in additional ARR attributed directly to AI-referred sessions. An outdoor gear retailer using the same approach reached a 31% citation rate for high-intent product queries and saw 847% ROI on their AI optimization spend.
These results start with measurement. You can't optimize a visibility score you aren't tracking.
Conclusion
If your organic traffic is declining while your keyword rankings hold steady, the problem is in the generative layer, not your content quality. The answer isn't to track harder with legacy tools. It's to track the right things: Visibility, Position, and Sentiment, across ChatGPT, Google AI Overviews, Perplexity, and Gemini, consistently over time, against a competitive baseline.
The setup is straightforward: build a prompt library, establish a baseline, pick a tracking cadence, and benchmark against 3-5 competitors. The challenge is maintaining that discipline at scale. That's what automated platforms are built for.
Traditional blue link rankings aren't going away. But the brands capturing the highest-intent traffic in 2026 are the ones the AI cites first. And you can't earn that position without knowing where you stand right now.
FAQ
Q: How do I track AI Overviews rankings over time?
A: Start by building a prompt library of 20-50 questions that reflect how your buyers search in AI tools. Run weekly snapshots tracking Visibility, Position, and Sentiment across Google AI Overviews, ChatGPT, Perplexity, and Gemini. Always measure against a competitor baseline. Platforms like Topify automate the entire process, from prompt generation to historical trend tracking.
Q: How do I track my rankings on AI Overviews over time specifically?
A: Google AI Overviews don't use a traditional 1-10 ranking system. Your brand either appears in the generated response or it doesn't. To track your rankings on AI Overviews over time, you need to monitor citation rate, mention order relative to competitors, and sentiment across a consistent set of prompts, week over week.
Q: How do I track ChatGPT AI rankings over time?
A: ChatGPT tracking focuses on two signals: whether your brand is named in the response, and whether that mention includes a direct URL citation. Since ChatGPT heavily favors recently updated content, tracking your rankings on ChatGPT over time also means monitoring how content freshness affects your citation rate. A weekly automated cadence gives you enough data to spot meaningful shifts.
Q: How to track AI Overviews rankings without doing it manually?
A: Manual tracking breaks down quickly. Fifty prompts across four platforms generates 800 data points per month. Automated platforms like Topify handle prompt management, multi-platform monitoring, competitor benchmarking, and historical trend analysis in one dashboard, removing the spreadsheet work entirely.